INTRODUCTION
Data Science for Economics (Spring 2021)
author: Madina Kurmangaliyeva
How to use this book
In this book, you will find video lectures, tutorials, and links to useful materials. On the left, you can find the panel with the sections of the course. The idea is that you follow the order of the material. For example, week 3 starts with a tutorial before a formal video-lecture on purpose.
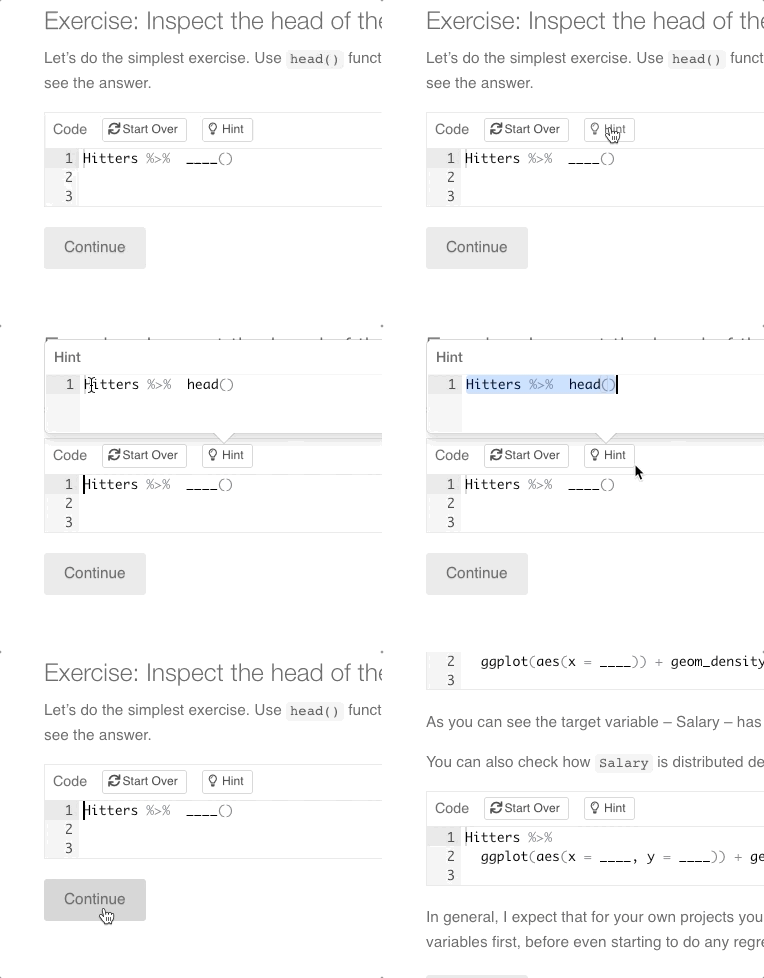
Most tutorials are in R and they are interactive. I have uploaded the tutorials on a cloud for your convinience, and hopefully it will work well. If you are stuck with the exercises, you can always click on the hint button to see a correct answer. The tutorial is gradually revealing, so click Continue button once you are ready to proceed to the next portion of the tutorial.

If the tutorial is for Python, download the jupyter notebook and open it on your own computer or on jupyterlab.uvt.nl.

Course organization
Please, study the relevant material beforehand each week. Then, send your questions by email in advance before the zoom session. This will allow me to prepare a fruitful Q&A and discussion sessions for each Friday.
We will have two short Q&A sessions with these invited speakers:
Dr Renata Rabovic, an applied scientist at Zalando (on March 12)
Dr Clemens Fiedler, a researcher in Financial Markets and Data Science at CPB (on March 26).
They kindly agreed to share their professional advice and their views on the job market for economists in data science positions.
Course content
We will spend two weeks studying prediction models and prediction theory: Lasso, Ridge, Decision Trees, Boosting, Bagging, and Random Forest.
The next two weeks, we will study how to use these prediction methods for causal inference: Double Selection, Double Machine Learning, and Generalized Random Forest.
This course is about handling large datasets in terms of number of potential controls (predictors), when usual econometric methods are inadequate and we need so called high-dimensional methods. Usually, econometric models assume that the number of variables in a regression is lower than the number of observations. But in many settings this is not true, especially if you consider all possible interaction terms between all variables. Also, in many settings the number of potential controls (predictors) grows together with the number of observations. So you end up in a high-dimensional framework, having lots of observations but even larger amount of potential controls (predictors). In this course you will learn how to search for good functional forms (i.e., model selection) in a data-driven way.
When you work in an RCT setting, you in principle do not need to control for anything, but you still want to explore heterogeneity in treatment effects. You will learn how to do it in a data-driven manner using Generalized Random Forest without running 1000 regressions by hand.
Most importantly, this part of the course will help you distinguish between prediction and inference problems, and choose right tools for each task.
